Coming soon
Unemployment by policy
How joblessness varies with the labor and economic policies countries choose.
Countries, compared
Nations in Data turns public statistics about countries into interactive 3D charts you can rotate, zoom and search. Each chart places every country on the same board, so you can see at a glance how policy, freedom and prosperity line up — and where they don’t.
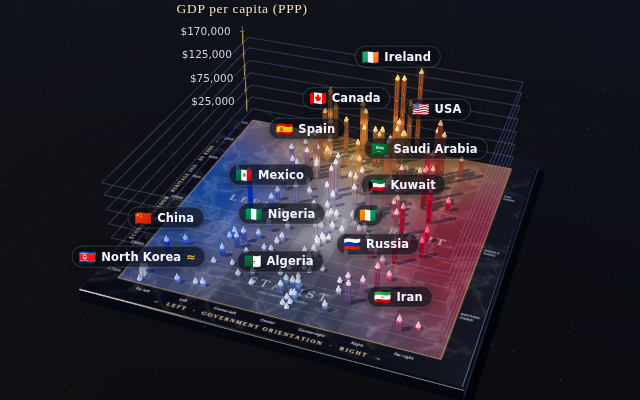
176 countries as glass columns on a marble Nolan chart. Depth is economic freedom, left to right is the orientation of each government, and height is GDP per capita.
How joblessness varies with the labor and economic policies countries choose.
What a home costs against what people earn, country by country.
Perceived corruption set beside the institutions and incomes around it.
Homicide rates across the world, and how far apart neighbors can be.
Reported crime and how safe people say they feel where they live.